How to Understand Your Podcast Analytics and Metrics That Matter
Your analytics dashboard shows 2,457 downloads this month. But what does that actually mean for your show’s growth? You stare at retention rates, listener demographics, and geographic data, wondering which numbers matter and which ones are just noise. Most podcasters feel this way. They’re overwhelmed by data but unclear on how to use it.
According to recent industry research, 67% of podcasters say understanding analytics is their biggest challenge. The problem isn’t lack of data. It’s lack of clarity about what that data means for growth decisions.
Here’s the truth: podcast analytics can be your roadmap to building a sustainable show, but only if you know which metrics actually matter and how to interpret them. This guide will give you that framework.

Quick Takeaways:
- Downloads vs unique listeners tell different stories about your show’s reach
- Retention rate predicts long-term success better than total downloads
- IAB certification matters because advertisers discount non-compliant analytics by 15-20%
- Geographic data helps optimize content timing and tour planning
- Focus on growth trends over daily fluctuations
What Are the Most Important Podcast Metrics to Track?
Not all analytics metrics are created equal. Some tell you about your show’s popularity, while others reveal whether your content actually resonates. Understanding this distinction separates growing podcasters from those with big download numbers but tiny engaged audiences.
Downloads vs Unique Listeners
Downloads count how many times your episodes are downloaded. Unique listeners count how many individual people tune in. Here’s why that matters: one person downloading ten episodes shows ten downloads but only one listener. Ten people each downloading one episode shows ten downloads but ten listeners.
According to Edison Research’s Infinite Dial 2024 study, podcast listeners subscribe to an average of 6 shows and listen to 7 different episodes weekly. This means unique listener count often better reflects your true audience size than total downloads.
Completion Rate and Retention
This is where the gold lives. Industry studies consistently show that 80% of listeners complete entire or most of each episode. But what about your other 20%? When do they drop off?
Retention rate tells you which episodes keep listeners engaged and where they typically stop listening. A 75% completion rate means three-quarters of your audience hears most of your content. That’s powerful data for content planning.
Growth Rate and Trends
Raw download numbers matter less than the trend line. Are you gaining 5% month-over-month or losing 10%? Growth rate reveals whether your content strategy is working or needs adjustment.
Recent data shows podcast listening grew 12% year-over-year, with 47% of Americans having listened to a podcast in the last month. But growth isn’t even across all genres. Understanding whether your specific niche is growing helps you decide whether to double down or pivot.
Geographic Distribution
Where your listeners live affects everything from content timing to tour planning. If most of your audience is in California, publishing at 2 PM EST makes sense. If they’re primarily in Europe, you might schedule releases for morning European time.
Geographic data also reveals expansion opportunities. Seeing unexpected growth in Australia might prompt you to create region-specific content or even interview local guests from that area.
Device and App Breakdown
Are your listeners primarily on Apple Podcasts, Spotify, or smaller apps? This affects how you optimize your content. Spotify users might discover you through playlists, while Apple Podcasts listeners often subscribe directly.
Device data also reveals technical preferences. Mobile listeners might prefer shorter episodes for commutes, while desktop listeners might engage with longer, deep-dive content.
How Do Downloads Actually Get Counted? (IAB Standards Explained)
You published an episode yesterday and already see 500 downloads. But how accurate is that number? The answer depends on whether your hosting platform follows IAB (Interactive Advertising Bureau) standards.
What Counts as a Download?
The IAB Tech Lab’s Podcast Measurement Guidelines define a download as “a request to a podcast host server by a user agent for the purpose of playback or download.” But here’s the crucial part: not all requests count.
IAB standards require platforms to:
- Filter out bot traffic
- Remove duplicate downloads from same IP within 24 hours
- Only count downloads when significant portion of content is accessed
- Exclude downloads under 60 seconds (likely accidental or incomplete)
Why IAB Certification Matters for Monetization
Here’s why this becomes critical: when you approach sponsors, they ask about your analytics. If your numbers aren’t IAB-certified, they typically apply a 15-20% discount to your reported metrics.
According to IAB compliance documentation, certified analytics provide:
- Bot filtering that removes artificial inflation
- Geographic and device data that’s verified
- Time-to-consumption metrics that reflect actual behavior
- Ad insertion metrics that advertisers trust
Non-certified platforms might count every download request, including bots and duplicates. This inflates your numbers but damages credibility with advertisers who know industry standards.
Download Processing Delays
Your analytics show 100 downloads today, but you know 50 people downloaded yesterday. Why the delay? Downloads can take 24-72 hours to process across different platforms and apps.
Apple Podcasts typically reports within 24 hours. Spotify might take 48 hours. Smaller apps could take even longer. This delay means your day-old analytics aren’t complete yet.
Understanding these delays prevents panic over seemingly low numbers. Give your analytics 48-72 hours to stabilize before drawing conclusions.
Reading Your Analytics Dashboard Like a Pro
Your analytics dashboard shouldn’t be a source of confusion. It should be a strategic tool for making better content decisions. Here’s how to extract actionable insights from the data.
Understanding Download Trends and Seasonality
Look beyond daily numbers to weekly and monthly patterns. Is your audience larger on weekends? Do certain topics perform better in specific months?
Seasonality affects every podcast. True crime shows might see spikes during summer break. Business podcasts often dip during holidays. Your content strategy should account for these predictable patterns rather than reacting to random fluctuations.
Identifying Drop-off Points in Episodes
Most analytics dashboards show listener retention within episodes. Where do people typically stop listening? The 5-minute mark? 15-minute mark?
This data reveals which content segments resonate and which ones lose people. If listeners consistently drop off during your intro segment, your hook needs work. If they stay through interviews but leave during solo commentary, that’s valuable feedback.
Using Geographic Insights for Content Strategy
Geographic data isn’t just interesting. It’s actionable. If you discover 30% of your audience is in the UK, you might:
- Feature UK-based guests or topics
- Reference British cultural touchpoints
- Schedule releases during UK prime time
Geographic clusters also reveal tour opportunities. Seeing concentration in specific cities helps plan live events or meetups.
Device and App Distribution for Technical Optimization
Are your listeners primarily on mobile devices? This affects episode length and production quality. Mobile listeners often consume during commutes, preferring shorter episodes that fit travel time.
Desktop listeners might engage with longer, complex content that requires focus. Knowing this helps you tailor both content and technical specifications like audio quality and file formats.
Metrics That Matter vs Vanity Metrics
Not all analytics data is created equal. Some metrics drive growth decisions, while others just feel good to look at. Understanding this difference prevents you from optimizing the wrong things.
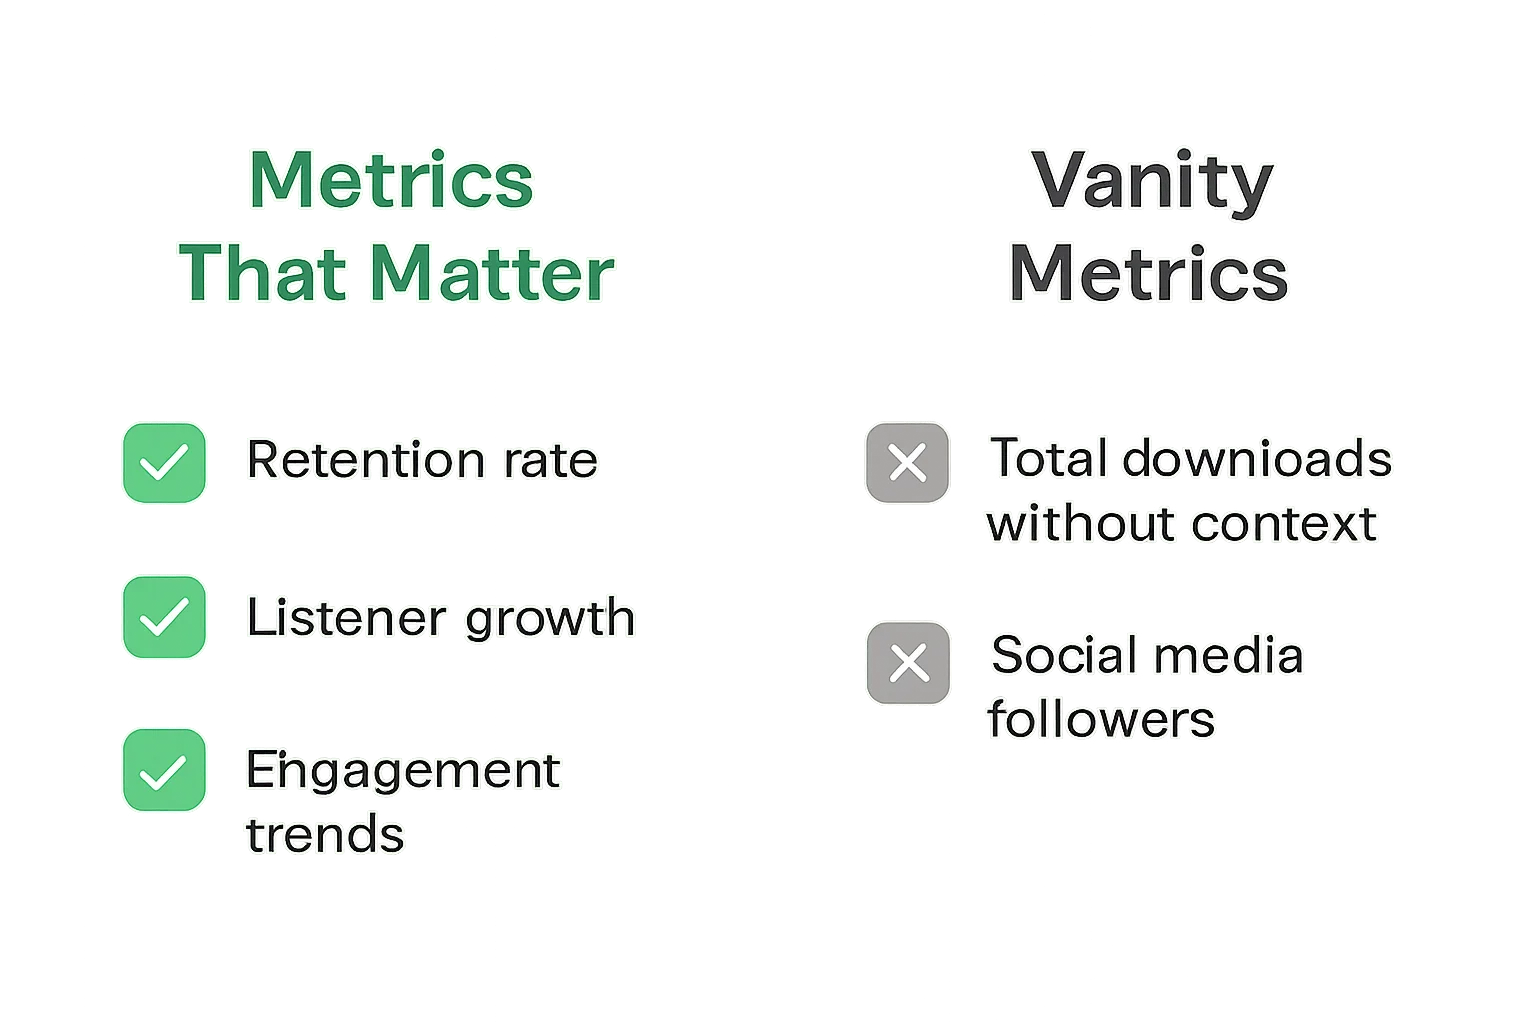
Metrics That Actually Matter
Retention Rate: The percentage of listeners who complete episodes. High retention (70%+) indicates content resonates and builds loyal audience.
Unique Listener Growth: Month-over-month increase in individual listeners. This shows your show is expanding its reach, not just getting more downloads from existing audience.
Engagement Trends: How listeners interact with your content over time. Are they listening to older episodes? Are they sharing specific episodes more than others?
Time-to-Consumption: How quickly listeners download new episodes. Fast consumption (within 24 hours) indicates engaged audience anticipating your content.
Vanity Metrics to Ignore
Total Downloads Without Context: Raw download numbers don’t indicate audience size or engagement without retention data.
Social Media Followers: Follower counts don’t correlate to podcast listening behavior or revenue potential.
Download Speed: How fast episodes are downloaded matters less than whether people actually listen to them.
Quick Takeaway: Focus on retention and subscriber growth over total downloads. Quality listeners beat quantity every time.
How to Use Analytics for Growth Decisions
Analytics shouldn’t just be reports. They should be strategic tools for making better content, distribution, and growth decisions. Here’s how to turn data into action.
Identify Best-Performing Episodes
Look beyond download totals to completion rates and listener retention. Which episodes have 80%+ completion rates? Which topics keep listeners engaged longest?
These patterns reveal your content sweet spots. Maybe interview episodes perform better than solo commentary. Perhaps how-to content retains listeners better than news updates.
Replicate success without becoming repetitive. Use the format and style that works, not just the exact topic.
Understand Audience Geography for Tour Planning
Geographic data isn’t just interesting. It’s practical for planning live events, meetups, or targeted content. If you have strong concentration in specific cities, those become prime locations for in-person events.
Time zone data helps optimize release schedules. Publishing when your largest audience segment is awake and commuting maximizes immediate listening.
Optimize Publish Times Based on Consumption Patterns
When do your listeners typically tune in? Analytics show time-to-consumption data. That’s how long after publishing most downloads occur.
If most downloads happen within 24 hours, your audience is actively anticipating your content. This supports consistent, predictable publishing schedules.
If consumption is spread over weeks, your content might be evergreen rather than timely. This affects your promotion strategy and content planning.
Content Strategy Based on Retention Data
Drop-off points reveal content weaknesses. If listeners consistently stop during specific segments, those segments need improvement or shorter length.
High-retention episodes reveal what your audience values most. Double down on formats, topics, and styles that keep people engaged through entire episodes.
When to Pivot Format Based on Performance
Sometimes analytics tell you that your current approach isn’t working. Maybe solo episodes underperform while interviews thrive. Perhaps short-form content gets better completion than long-form.
Pivoting isn’t failure. It’s responding to data. Use analytics to test new approaches and measure results before committing fully.
Analytics Comparison Across Podcast Platforms
Not all analytics dashboards are created equal. Platform capabilities vary significantly, affecting what insights you can access and how easily you can interpret them.
Platform Capabilities: Advanced vs Standard vs Basic
Advanced Analytics (typically premium tiers):
- Real-time listener data
- Detailed demographic breakdowns
- Episode performance comparison tools
- Custom date range analysis
- Integration with third-party analytics tools
Standard Analytics (most platforms):
- Basic download and listener counts
- Geographic distribution (country level)
- Device breakdown
- Monthly performance reports
Basic Analytics (budget platforms):
- Download totals only
- Limited geographic data (region level)
- No retention data
- Delayed reporting (weekly or monthly)
What’s Included at Different Price Points
Free platforms often provide basic analytics with limited historical data. Mid-tier plans typically add retention metrics and more detailed breakdowns. Premium tiers usually include advanced features like custom date ranges and comparative analysis.
IAB certification varies by platform. Some include it in all plans, while others reserve it for premium tiers. This matters when monetization is your goal.
VNYL’s Analytics Approach
VNYL includes IAB-certified analytics on all plans, not just premium tiers. This ensures accurate metrics from day one, regardless of your plan level.
The dashboard focuses on clarity over complexity. You see retention rates, growth trends, and geographic data without navigating confusing interfaces or upsells to advanced features.
Compare VNYL’s analytics features to other platforms to see how different hosting providers approach analytics capabilities.
Common Analytics Mistakes to Avoid
Even experienced podcasters make these mistakes. Understanding them helps you focus on what actually drives growth rather than getting distracted by misleading metrics.
Obsessing Over Daily Fluctuations
Daily download numbers will fluctuate. Some days will be high, others low. This is normal, especially for newer shows with smaller audiences.
The problem isn’t fluctuations. It’s overreacting to them. Making content changes based on one day’s data is like steering a ship by looking at the wake behind you.
Focus on weekly and monthly trends instead. Daily numbers are noise; trends are signals.
Comparing to Established Shows Without Context
Your show with 50 downloads per episode looks small compared to podcasts getting 5,000 downloads. But that comparison lacks crucial context.
Established shows have years of audience building, SEO authority, and network effects. Comparing your month 3 to their month 60 is like comparing different businesses entirely.
Instead, compare your show to others at similar stages. Look at growth rates, retention patterns, and audience engagement relative to your current position.
Ignoring Retention for Total Downloads
Total downloads without retention data can be misleading. A show with 10,000 downloads but 20% retention has fewer engaged listeners than a show with 5,000 downloads and 80% retention.
Advertisers increasingly understand this. They care about engaged audience size, not just raw download numbers. This is why IAB certification emphasizes engagement metrics.
Not Tracking Trends Over Time
Single data points tell you nothing about direction. Are your monthly downloads growing 5% month-over-month? Declining 2%? Flat?
Trends reveal whether your strategy is working. Three months of declining growth signals that something needs to change, even if absolute numbers still look good.
Misunderstanding Download Processing Delays
Different platforms report downloads on different schedules. Apple Podcasts might show numbers within 24 hours, while other platforms take 48-72 hours.
Don’t panic when day-old numbers seem low. The data might still be processing. Wait 3-4 days before analyzing performance to get complete picture.
The Bottom Line on Podcast Analytics
Your analytics dashboard is a strategic tool, not a report card. The metrics that matter, like retention rate, unique listener growth, and engagement trends, tell you whether your content strategy is working.
Vanity metrics like total downloads or social media followers feel good but don’t drive decisions. Focus on the data that reveals audience behavior and content performance.
Remember that different platforms provide different levels of analytics sophistication. IAB-certified analytics ensure your numbers are accurate and comparable across the industry.
The goal isn’t to have impressive analytics. It’s to understand your analytics well enough to make better content, serve your audience more effectively, and build a sustainable podcast.
Want more podcasting tips like these? Join our newsletter at vnyl.fm for weekly insights.